Adding a Command-Line Interface
Aim
We are going to write a command line interface (CLI) for our Python plot function.
Objectives:
- You will learn how to write a CLI with the Python library argparse.
Run the plotter CLI
Go to the plotter tutorial source:
$ cd ~/birdhouse-workshop/tutorials/03_plotter_cli
See the command line options of our plotter:
$ python plotter.py -h
usage: plotter.py [-h] [-V [VARIABLE]] dataset
Plot our well-know image:
$ python plotter.py --variable air ../../data/air.mon.ltm.nc
Exercise 1
Play a little bit with the command-line options. Try some other options (-V),
use invalid input (water) and skip some arguments.
Exercise 2
Use external data from a Thredds service, like NOAA:
https://www.esrl.noaa.gov/psd/thredds/catalog/Datasets/ncep.reanalysis.derived/surface/catalog.html
See access methods for a dataset, note OpenDAP:
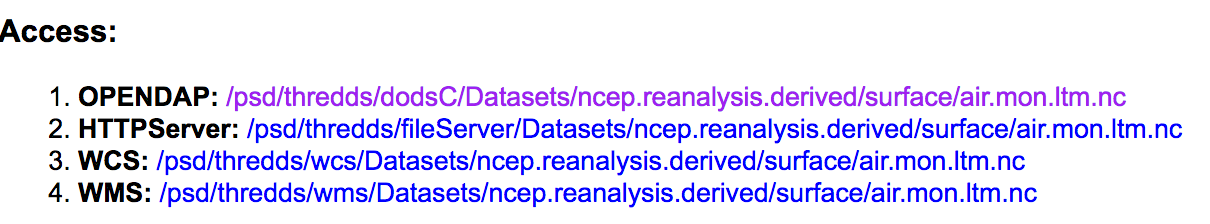
Use OpenDAP URLs directly as dataset input:
http://www.esrl.noaa.gov/psd/thredds/dodsC/Datasets/ncep.reanalysis.derived/surface/air.mon.ltm.nc

$ python plotter.py --variable air \
      http://www.esrl.noaa.gov/psd/thredds/dodsC/Datasets/ncep.reanalysis.derived/surface/air.mon.ltm.nc
Exercise 3
Extend the command line and with an optional parameter for
the timestep to be plotted.
Open your editor on plotter.py … and happy hacking.
Don’t forget to test often:
$ pytest plotter.py
Exercise 4
The output name of the plot is always plot.png. Add an optional output
parameter to set an output filename.