Writing a simple Plot Function
Aim
We are going to write a simple plot function in Python using matplotlib and cartopy.
Objectives:
- You will learn how to install packages with Conda.
- You will learn the basic usage of the netCDF, matplotlib and cartopy Python libraries.
Run the plotter
Go to the plotter tutorial source:
$ cd ~/birdhouse-workshop/tutorials/01_plotter
Try the plotter Python module:
$ python plotter.py
Traceback (most recent call last):
File "plotter.py", line 1, in <module>
  import matplotlib.pylab as plt
ModuleNotFoundError: No module named 'matplotlib'
Oops, something is missing … please install the matplotlib package via Conda:
# Let's see what is available
$ conda search -c conda-forge matplotlib

# ... and install it from the conda-forge channel
$ conda install -c conda-forge matplotlib
Conda will show you a list of packages, which are going to be installed.
Have a look at this list and answer with y or just press enter.
The following NEW packages will be INSTALLED:

matplotlib:       2.0.2-py36_2  conda-forge

Proceed ([y]/n)?
We should check now the plotter.py source code.
Open the plotter.py in your favorite editor, some people like vim:
$ vim plotter.py
Besides matplotlib there is another import for netCDF4:
from netCDF4 import Dataset
Let us install netcdf4:
# same procedure as above ...
$ conda search -c conda-forge netcdf4
$ conda install -c conda-forge netcdf4
So, we should now be ready to run the plotter:
$ python plotter.py
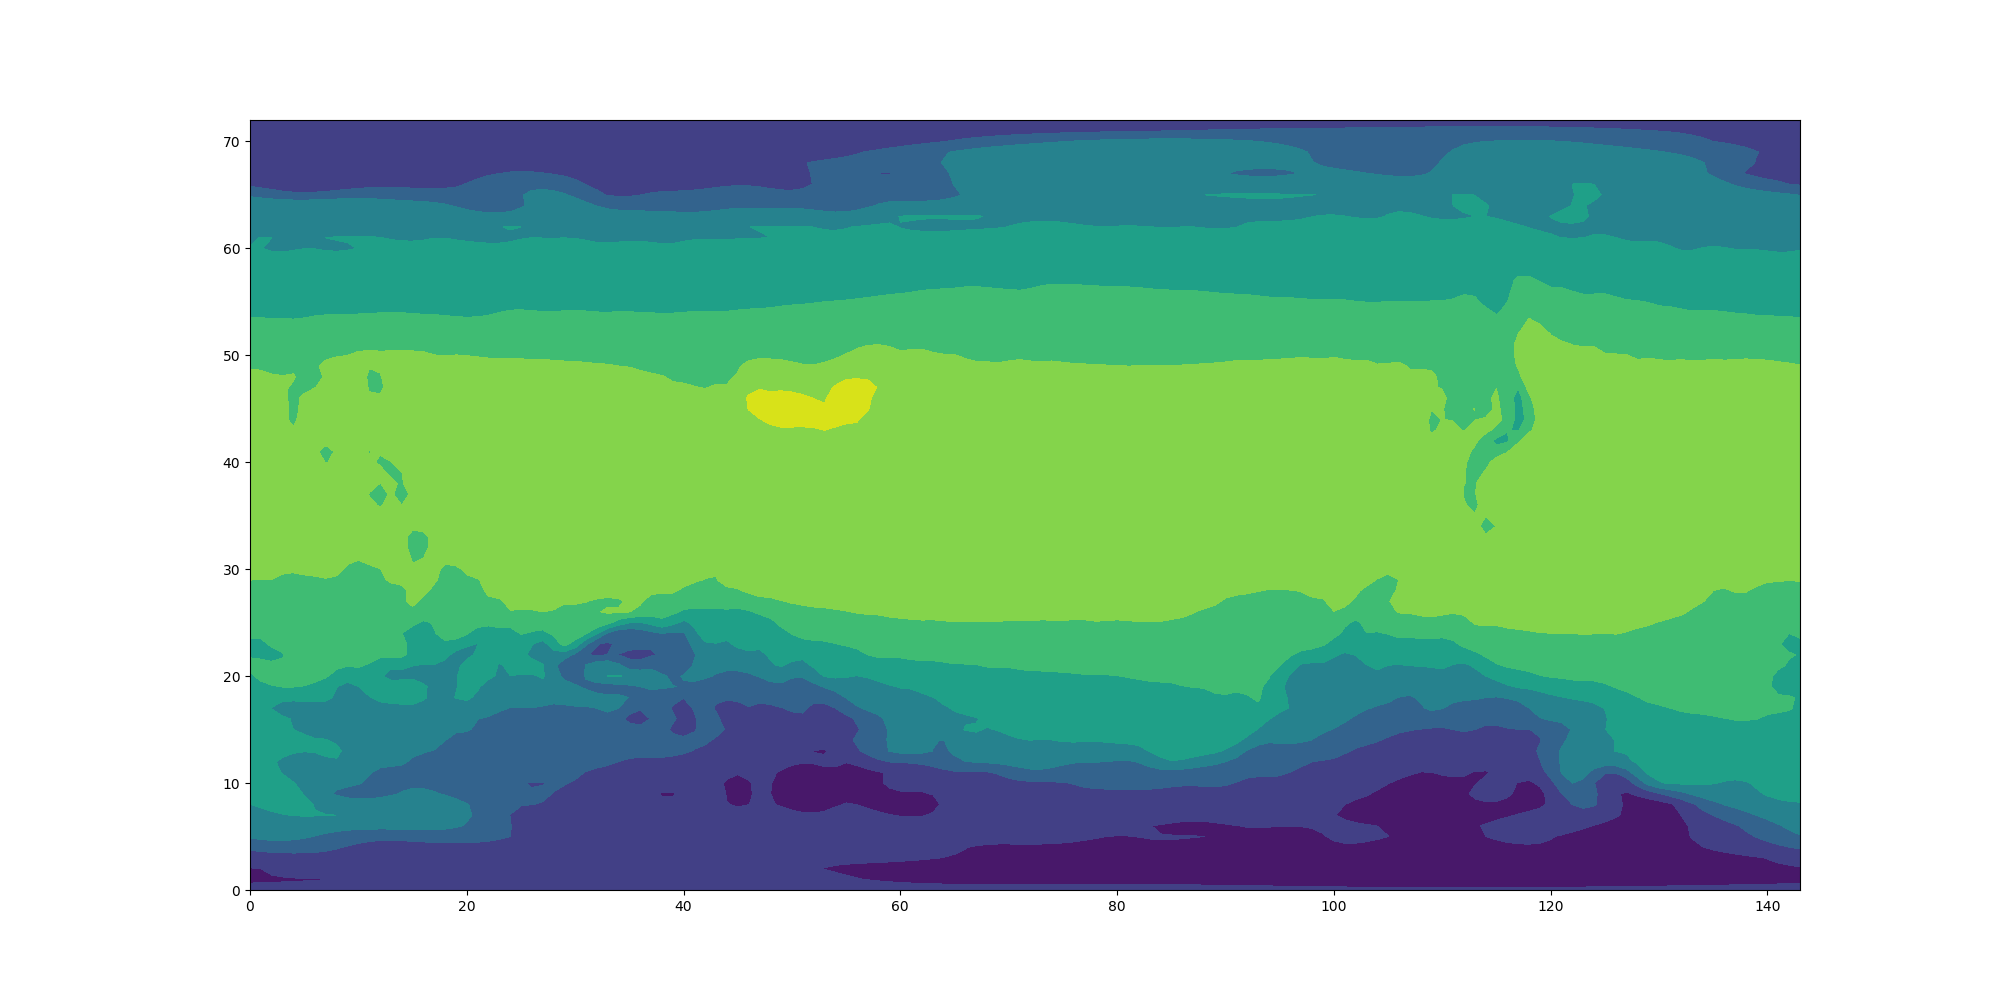
Plotting ../data/air.mon.ltm.nc ...
Plot written to plot.png
A plot was generated. Open it in your favorite image viewer.
On Ubuntu/LinuxMint you can try Eye of Gnome, on macOS just say open:
$ eog plot.png  # on Ubuntu use Eye of Gnome
or
$ open plot.png # on macOS
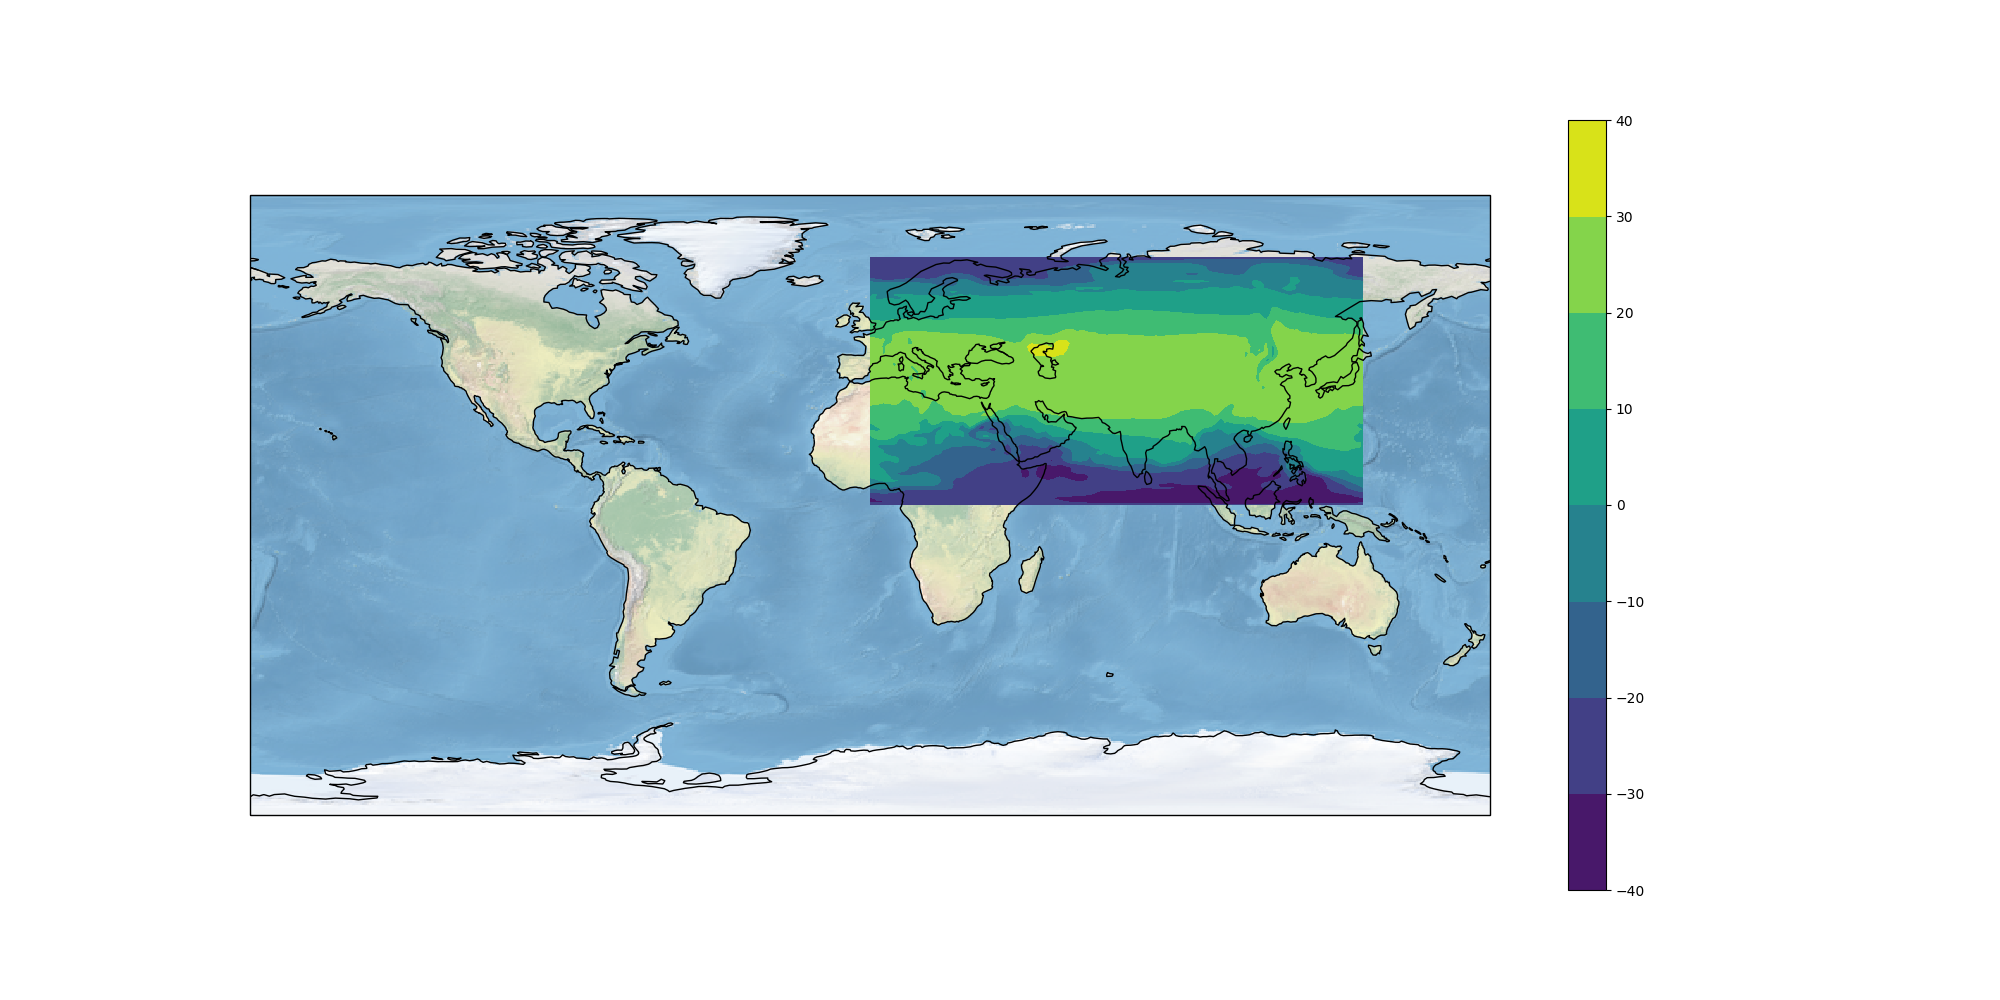
The image should look like the following:
Exercise
Open the plotter.py and implement the following features:
- add a colorbar
- add a background map with coastlines
- use a PlateCarree map projection
You will need an additional Python package, cartopy, which you can install with conda.
This package is available on the conda-forge channel.
You need to provide an option with the conda channel:
$ conda install -c conda-forge mypackage
Read the code and comments carefully to make this work.
The final result should look like this: